- anybody taken a statistics course that they liked, or
- or recommend a good book to learn the basics?
(posted on facebook, too, for easier commenting)
Statistics is the mathematical branch of critical thinking. There's some good arguments that it matters more than calculus.
( http://www.ted.com/talks/arthur_benjamin_s_formula_for_changing_math_education.html)
I never took statistics. Which might make it hard to teach.
(On the other hand, as a self-taught person I might be able to make a more compelling presenter, since I'm one of those weird people who actually thinks it matters. But that depends on me being able to present to "normal" people, and people who are different kinds of weird than me. You readers are probably far more like me than different, but your experiences are a useful first step towards a broader perspective.)
- Do you remember any insights from statistics?
Either classroom, or from applying statistics in a real-world situation?
I'm looking for personal stories that could make a non-maths person curious to learn more, and/or give me personally a 'hook' to study more of the basics.
Statistical literacy matters for health, and weather, and farming, and quantum theory, and for evaluating critical evidence in our increasingly complicated (and legalistic) world.
It helps us understand what the actual relationships are between touchy subjects like race, poverty, and disease, as in Hans Rosling's TED talks with the bouncing bubble graphs. It may be one of the fairest tools for making good, effective laws instead of laws that make things worse.
(http://www.ted.com/talks/hans_rosling_shows_the_best_stats_you_ve_ever_seen.html)

www.ted.com
You've
never seen data presented like this. With the drama and urgency of a
sportscaster, statistics guru Hans Rosling debunks myths about the
so-called "developing world."
Glossy graphs are the fun part, at least the way Hans Rosling does them.
But the integrity of the process is about asking the right questions, and realizing what data to pursue.
(For example, would some other measurable quantity like hours of sleep, or levels of stress hormones, be a better mark of national welfare than per-capita income?)
One engaging life lesson is how statistical literacy helps you know when someone is trying to fool you.
But even more critical is being able to use good data to realize when you are trying to fool yourself; though that's much harder.

But is that decline a drop from 80% to 30%, about to bottom out entirely? Or is it only a noticeable drop between 98% and 93%? I've seen this type of graph presented where the lower 'axis' was set way above zero; and in fact, it's very common to re-set the axes to a different scale or origin for each data set.

Likewise, if I was thinking about investing in a particular company or product, I'd want to check the axes on their graphs of cheerful upward curves too.
I also need to know how this compares to other similar situations.
- Is it normal for the drop to occur (for example a seasonal drop in employment in a farm community, which we just save up and plan for every year)?
- Or is a small change a huge difference (a change from 99.9% to 97% in DNA similarity is the difference between a human and a chimpanzee.)
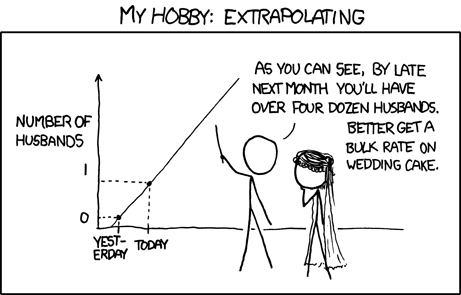
"If this trend continues" is a big IF, as well.
- What are some important parts of statistical analysis? that people get wrong?
What are some good ways to help them get it right?

- Have you ever found statistics a real help in making a real-world decision?
(Sometimes it's not really a help... sometimes it just quantifies the unknowns.)
("Lanes" / http://xkcd.com/931/)
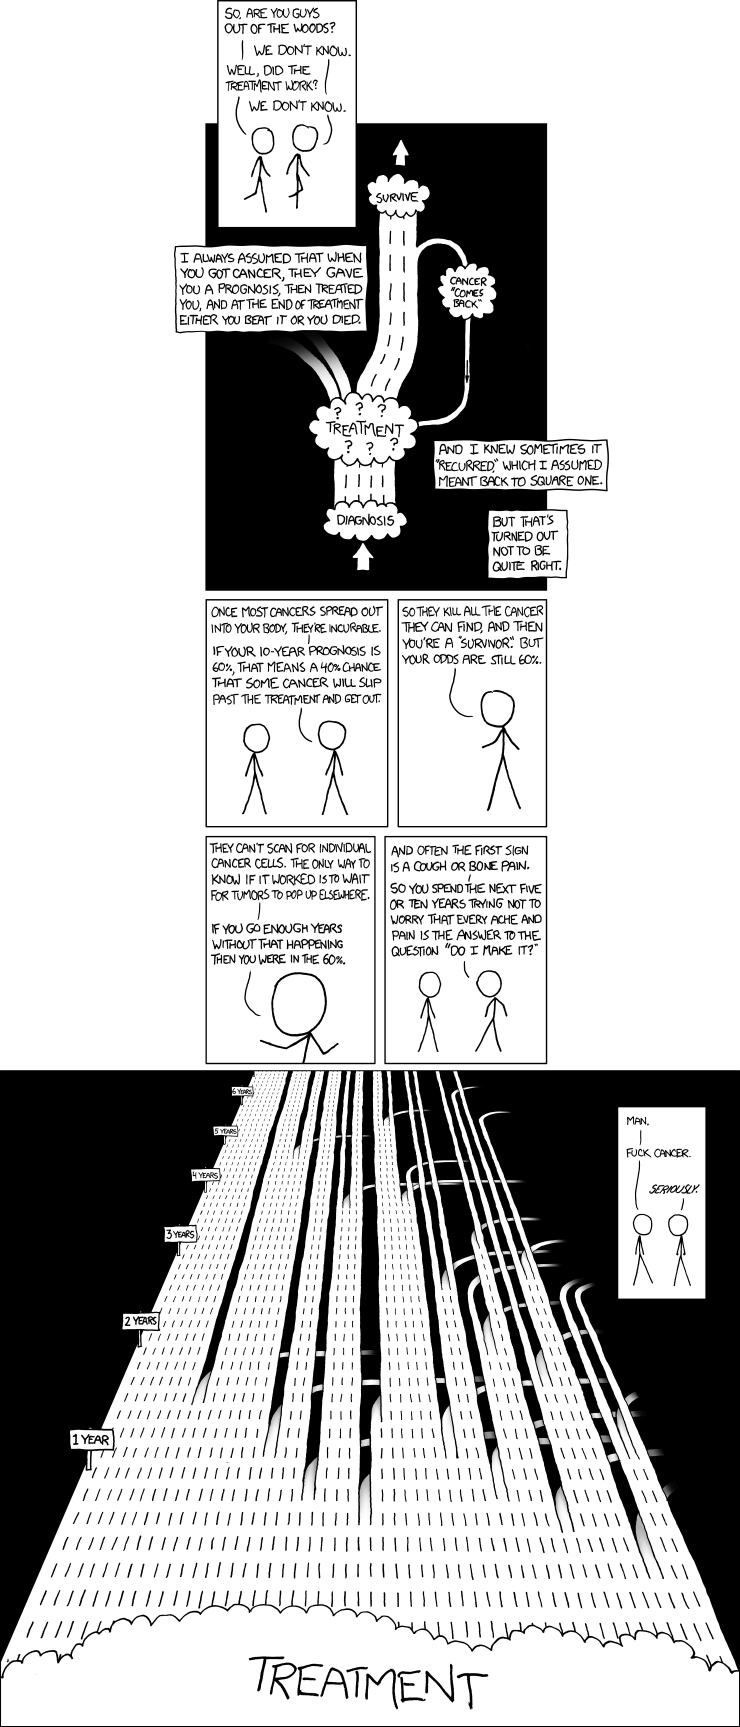
- Have you ever used statistical analysis to make a big mistake, or bad personal decision? When is statistics not the best tool for the job?
- What's your favorite big lie that people tell with statistics?
(Are the arguments faulty, accurate but misleading, or does statistics point toward something we can't accept as true?)
This video covers some court cases where mis-use of percentages can get someone wrongfully convicted. (No, mis-use of percentages is not a crime; the people whose error resulted in years of jail time walked away with nothing more serious than a little egg on their faces.)
Experts can sway juries with numbers, even when neither of them knowing the right questions to ask about the statistics. Pretty scary.
http://www.ted.com/talks/peter_donnelly_shows_how_stats_fool_juries.html
- Have you ever helped with a community decision by gathering data? Had a class of students help in this way?
- Where do you got for reliable data when you want to make a decision?
Statistically speaking, based on my past experiences, that is WAAAY too many questions. Even with comics. My chances of getting responses here are lower than on the original Facebook post.
Feel free to ignore some questions, and just tell me if you thought of anything while reading this post.
I think the best place to respond might be that Facebook post I mentioned, same date.
But please feel free to comment here, or reach me privately, as well.
Links to good online content, books, and papers are very much appreciated; and feel free to anonymize any stories you don't want shared.
Many thanks to XKCD.com for routinely exploring this territory in repeatable ways.
Yours,
Erica W